- Queue-based incident processing with one-ticket-at-a-time worker execution.
- Control API for standardized plan submission and host-aware ticket routing.
- Cloud-model orchestration with fallback strategy and structured outputs.
- Restore-only execution contract to keep runtime stable and reproducible.
Business + Engineering
PlanetOnyx Edge Platform
A VPS-first ingress with private-by-default services, centralized TLS, and measurable operations. Built to feel like a small production platform, without the production overhead.
Private by default
Centralized TLS
Observable
Low-toil ops
BSI baseline fulfilled
Publishing policy: Only aggregated values are shown here. No internal IPs, secrets, or private
hostnames are exposed.
Featured Article: Ultimate Repair Center (URC)
URC is the new dedicated project for restore-only operations and autonomous incident processing. It separates operational execution logic from platform documentation and provides a clean delivery path for ongoing updates.
- Included: runtime operations code, worker orchestration, API, queue lifecycle.
- Excluded: knowledgebase modules, security/compliance automation, firewall redesign.
- All feature updates are published through the URC Git history and changelog.
Pinned Article: cockpit-zfs-manager
cockpit-zfs-manager is the storage operations module for the new stack. It extends Cockpit with a
practical UI for ZFS, NFS and SMB operations without breaking the host-native workflow.
- Reads active ZFS pools/datasets and exposes pool health, allocation and filesystem controls.
- Provides NFS export visibility and management in one operational view.
- Provides SMB share visibility and management aligned with storage datasets.
- Runs as Cockpit module and keeps command execution on the managed host side.
- Built for production-like storage operations with clear, repeatable actions.
- Theme-compatible with Cockpit for consistent operator UX.
- Designed for iterative hardening; current release line is alpha.
Business Narrative
The platform story is structured as a buyer-friendly value chain: reduce exposure, increase reliability, and create audit-ready visibility. This keeps technical depth while still making commercial value obvious.
How infrastructure decisions are translated into measurable business outcomes.
Design BaselineZero-trust defaults, naming, segmentation
Control LayerIdentity, ACLs, policy routing, TLS automation
Operational LayerMonitoring, runbooks, incident evidence
Business OutcomeHigher uptime, lower risk, faster change delivery
Public-safe KPI framing for stakeholders.
| Objective | Metric | Target | Status |
|---|---|---|---|
| Service availability | 2xx/3xx ratio | > 99.0% | tracking |
| Access protection | auth + bouncer gates | 100% private apps | active |
| Recovery readiness | restore drill cadence | monthly | in progress |
| Security hygiene | token rotation backlog | zero overdue | open items |
Delivery Process (Engineering Lifecycle)
A repeatable process keeps this environment stable under change. Every phase has evidence and rollback logic.
Tap to zoom
Risk Matrix (Operational Security)
Risks are handled as a matrix: likelihood vs impact, with explicit controls. This avoids ad-hoc fixes and keeps policy decisions explainable.
Impact \ Probability
Low
Medium
High
Low
Routine config drift
Minor dashboard gap
Single-service restart loop
Medium
DNS cache staleness
Split-DNS inconsistency
Exit-node route instability
High
Token exposure risk
ACL mismatch blocks ops
Ingress + auth outage
- Change guardrails with backup-before-apply and explicit rollback path.
- Least-privilege ACL model with dedicated tags and policy checks.
- Central log pipeline plus targeted alerts (no alert noise flood).
- Every critical change is validated by runtime checks (route, DNS, HTTP, logs).
- Security events are correlated across firewalls, VPS, and app ingress.
- Backup and restore outcomes are documented as operational evidence.
Glossary (Read This First)
Short definitions of the terms used throughout the page. This reduces confusion and makes the architecture easier to reason about.
Traefik's named listener (for example
Router
http on :80, https on :443).A rule (Host/Path) attached to an entryPoint, pointing to a service.
Service
Upstream destination (container port, URL list).
Middleware
A request/response transformer or gate (auth, headers, rate limit, allowlist).
Self-hosted control plane compatible with Tailscale clients.
Tailnet
Encrypted overlay network of your devices.
Exit node
A node that provides a default route for clients (internet via tailnet).
Split DNS
Different DNS answers depending on where you query from (public vs LAN vs tailnet).
Live Snapshot (Public-Safe)
Data source: local system components (Traefik access log, K3s runtime, Headscale, CrowdSec). Only aggregated values are shown; no internal hostnames/IPs are published.
loading…
Window: —
Requests (last window): —
Latency: p50 — / p95 — / p99
—
Status: —
Headscale nodes: —
Headscale online: —
CrowdSec active decisions: —
Traefik routers: —
Public traffic (all): —
Tailnet traffic (all): —
Running state + uptime from K3s workloads and core edge services.
| Component | Running | Health | Uptime |
|---|
Edge total requests (window): —
Edge p95: —
Edge status: —
Operational Updates (Current)
Recent platform changes that were applied live and verified from runtime signals (service status, packet flow, and ingestion metrics).
- K3s baseline active on
ct210..ct214; storage backend runs onkilox-stor001with ZFS. - Ingress remains fixed on HAProxy VIP
10.10.10.6:443(no direct node-IP cutover). - Tailnet + LAN routes validated after failover events and recovery runs.
- Syslog pipeline remains active:
rsyslog -> promtail -> loki -> grafana. - OPNsense and CrowdSec sources are mapped into Grafana dashboards.
- Monitoring focus is on runtime operations and incident debug retention.
- All five workers are online and idle-ready in restore-only mode.
- Canary plan flow validated:
sre_diagnoser -> executorhandoff works. - Executor dry-run completed via
ops-repairwithout drift changes.
- Large incremental backup set completed on PBS on
2026-03-06. - Included:
host/vps-planetonyx,ct/210..216, andhost/kilox-stor001-nfs-apps. - Current restore posture: full VPS + Proxmox CT + NFS app-data recovery path verified.
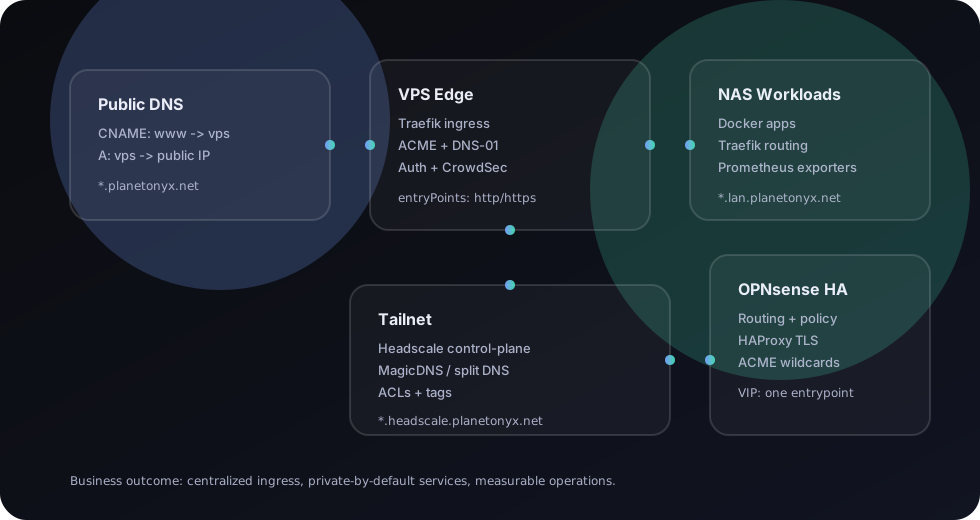
Architecture Diagram
Toggle layers in the menu to focus on specific flows (public ingress, tailnet, LAN workloads, security gates).
Tap to zoom
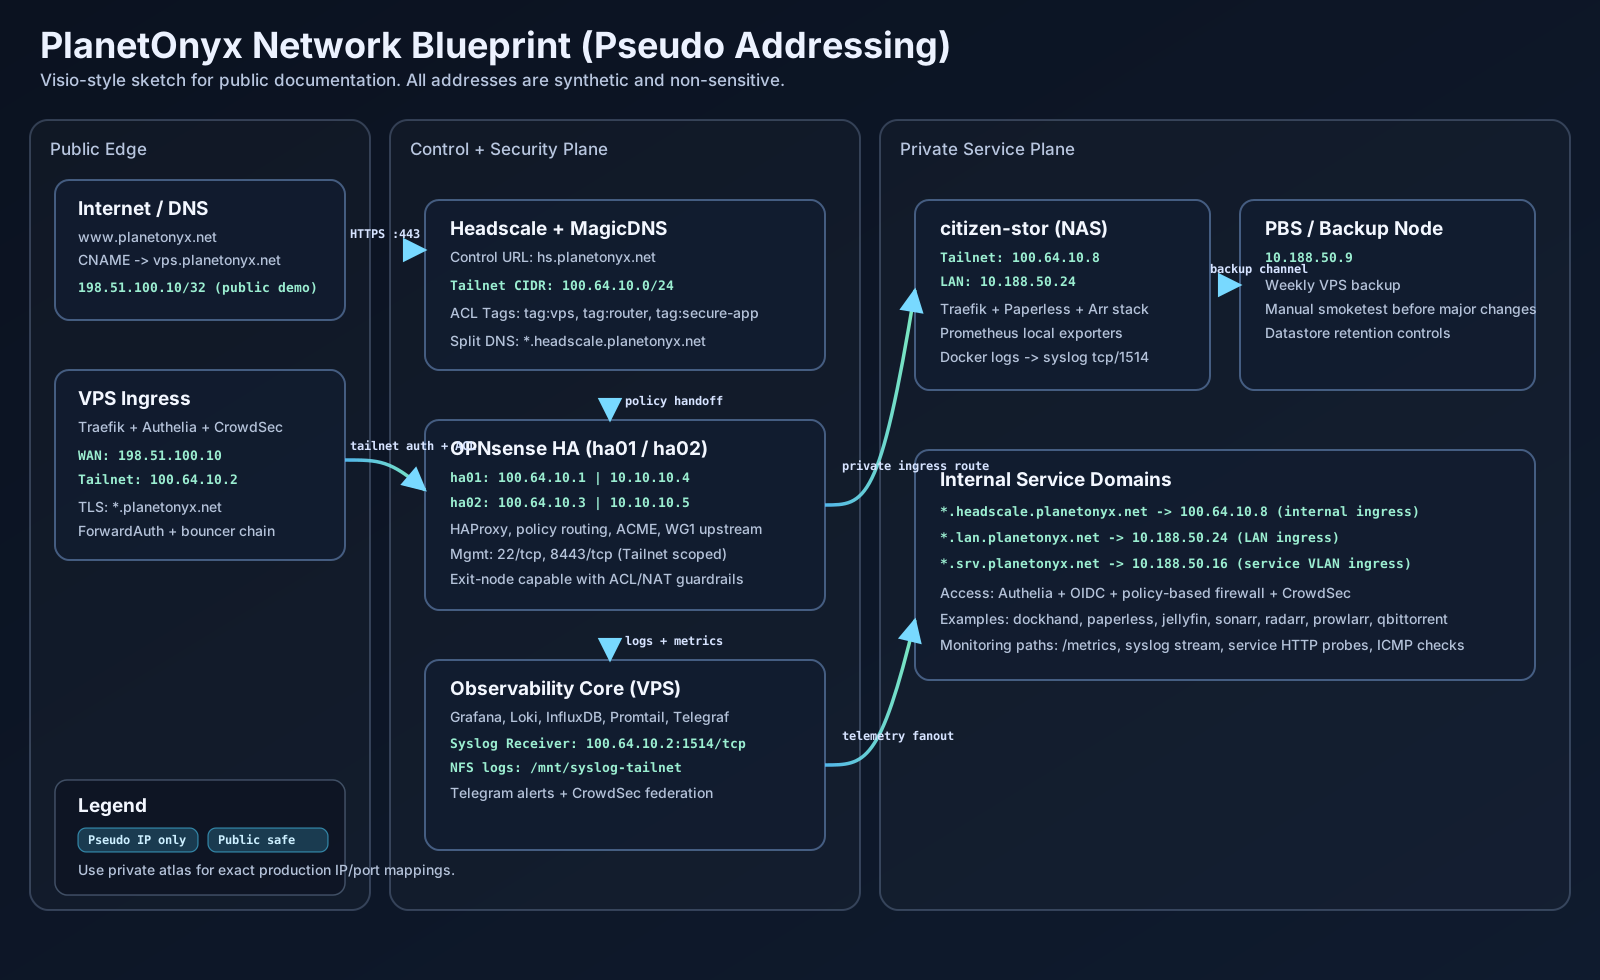
Network Diagram (Detailed Example)
This is an example of how the network layout can be represented for documentation and audits. It intentionally uses template ranges and labels: the structure is realistic, but the exact addresses should be treated as illustrative.
Tap to zoom
- Where TLS terminates (VPS ingress vs internal VIP).
- Where policy is enforced (ACLs, firewalls, allowlists, auth gateways).
- Which domains are public vs private (split DNS boundaries).
- Which paths are control-plane vs data-plane.
- Publish exact details only on an internal/private page.
- For the public page, keep ranges generic and use aggregated metrics.
- Never publish tokens, key material, or admin endpoints.
Rack Plan (Data Center Example)
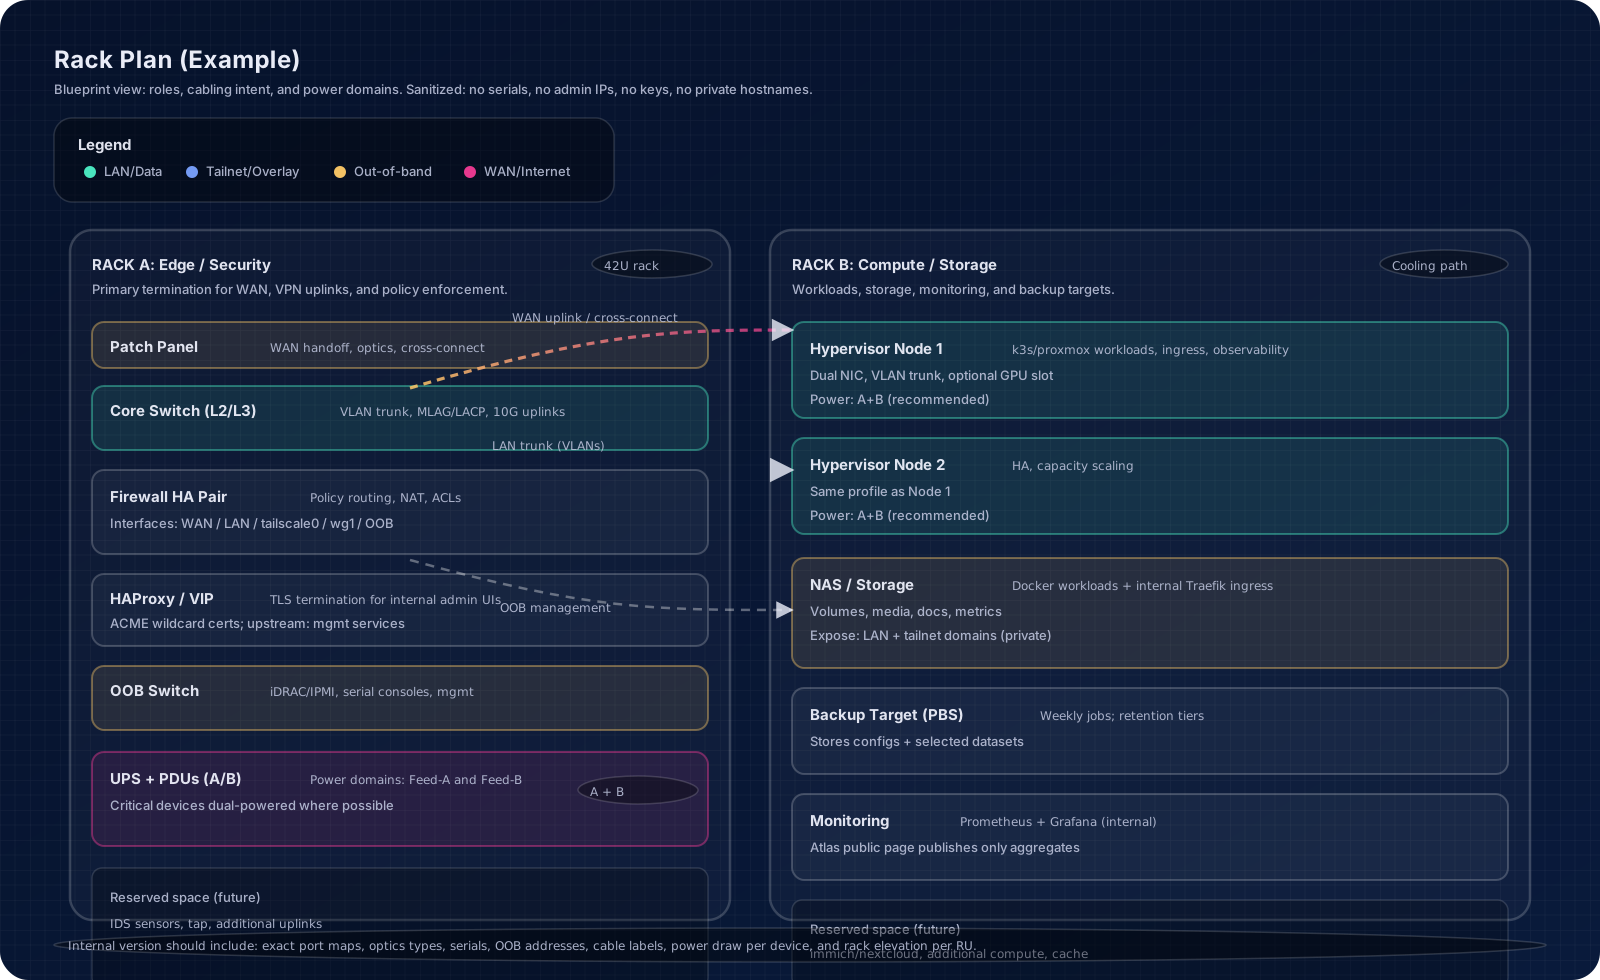
A “rack view” is often what ops teams use during installs, incident response, and audits. This is a sanitized, plausible layout: it shows role separation, power domains (A/B), and cable intent (WAN, LAN, out-of-band), but it does not publish any sensitive or identifying details.
Tap to zoom
- Document power redundancy (A/B feeds) and critical dependencies (firewalls, switches, storage).
- Keep control-plane reachable (OOB) even when the main network is degraded.
- Reduce mean-time-to-repair by mapping “what is where” to ports and roles.
- Exact port maps (switch ports, patch panel numbers, optics types).
- Device serials, iDRAC/IPMI addresses, inventory and warranty dates.
- Thermal and power budget calculations per rack.
Configuration Library (Sanitized)
These examples are deliberately close to a real working setup, but scrubbed: no tokens, no internal IPs, no private hostnames, no keys. Treat them as templates.
EntryPoints + providers + ACME resolver names.
api:
  dashboard: true

entryPoints:
  http:
    address: \":80\"
    http:
      redirections:
        entrypoint:
          to: https
          scheme: https
  https:
    address: \":443\"

providers:
  docker:
    endpoint: unix:///var/run/docker.sock
    exposedByDefault: false
  file:
    filename: /config.yaml

certificatesResolvers:
  cloudflare:
    acme:
      email: you@example.com
      storage: acme.json
      dnsChallenge:
        provider: cloudflare
        resolvers:
          - 1.1.1.1:53
- 1.0.0.1:53Middleware wiring (SSO + CrowdSec) and an internal-edge router.
http:
  middlewares:
    authelia:
      forwardauth:
        address: http://authelia:9091/api/authz/forward-auth
        trustForwardHeader: true
    crowdsec-bouncer:
      forwardauth:
        address: http://bouncer-traefik:8080/api/v1/forwardAuth
        trustForwardHeader: true

  routers:
    headscale-edge:
      entryPoints: [https]
      rule: HostRegexp(`{subdomain:[a-z0-9-]+}.headscale.planetonyx.net`)
      middlewares: [authelia, crowdsec-bouncer]
      tls: { certResolver: cloudflare }
      service: home-edge

  services:
    home-edge:
      loadBalancer:
        passHostHeader: true
        servers:
          - url: http://<FIREWALL_A_TS_IP>:80
- url: http://<FIREWALL_B_TS_IP>:80The key is: correct entryPoint + resolver + network.
services:
  about-site:
    image: your/about-site:latest
    networks: [proxy]
    labels:
      - traefik.enable=true
      - traefik.docker.network=proxy
      - traefik.http.routers.www.rule=Host(`www.planetonyx.net`)
      - traefik.http.routers.www.entrypoints=https
      - traefik.http.routers.www.tls=true
      - traefik.http.routers.www.tls.certresolver=cloudflare
      - traefik.http.services.www.loadbalancer.server.port=80

networks:
  proxy:
external: trueKeep DNS and reachability separate: DNS resolves, ACL decides.
// policy.hujson (template)
{
  \"groups\": { \"group:admins\": [\"marcus@example.com\"] },
  \"tagOwners\": {
    \"tag:vps\": [\"group:admins\"],
    \"tag:secure-app\": [\"group:admins\"]
  },
  \"acls\": [
    { \"action\": \"accept\", \"src\": [\"group:admins\"], \"dst\": [\"tag:secure-app:*\" ] },
    { \"action\": \"accept\", \"src\": [\"tag:vps\"], \"dst\": [\"tag:secure-app:2375\" ] }
  ]
}Sanitized HAProxy-style pattern.
# Frontend: terminate TLS on VIP
frontend fe_https
  bind :443 ssl crt /path/to/wildcard.pem
  mode tcp
  default_backend be_nas_https

backend be_nas_https
  mode tcp
server nas_ingress <NAS_INGRESS_IP>:443 ssl verify noneInternal view points internal names to internal ingress.
; db.lan.planetonyx.net (template)
$ORIGIN lan.planetonyx.net.
@   IN SOA  ns1.lan.planetonyx.net. hostmaster.lan.planetonyx.net. (
        2026021801 3600 600 1209600 300 )
    IN NS   ns1.lan.planetonyx.net.

; Internal ingress targets
prometheus IN A  <NAS_INGRESS_IP>
paperless IN A <NAS_INGRESS_IP>Keep the public snapshot fresh without exposing anything sensitive.
# /etc/systemd/system/atlas-data.service
[Service]
Type=oneshot
ExecStart=/root/about-site/tools/generate_public_atlas_data.sh

# /etc/systemd/system/atlas-data.timer
[Timer]
OnCalendar=*:0/5
Persistent=true

[Install]
WantedBy=timers.targetBackups should include both data and config.
# Example checklist
1) firewall config export (config.xml)
2) docker compose/stack definitions
3) critical volumes (app data)
4) control-plane state (headscale DB)
5) verify restore path (smoke restore)
Official Vendor Code References
This section combines official documentation with direct upstream source-code pointers. Snippets are shortened
for readability and adapted to example.com, but mapped to real implementation files.
services:
  app:
    image: nginxdemos/hello
    labels:
      - traefik.enable=true
      - traefik.http.routers.app.rule=Host(`app.example.com`)
      - traefik.http.routers.app.entrypoints=https
      - traefik.http.services.app.loadbalancer.server.port=80
Upstream code:
traefik/pkg/config/dynamic/http_config.go
Reference baseline:
traefik/traefik branch master, checked on February 20, 2026.
Explanation: labels become router/service objects inside Traefik's dynamic HTTP config model.
{
  "log-driver": "syslog",
  "log-opts": {
    "syslog-address": "tcp://log-gateway.example.com:1514",
    "syslog-format": "rfc5424micro",
    "tag": "{{.Name}}"
  }
}
Source:
Docker Syslog Driver (official)
Upstream code:
moby/daemon/logger/syslog/syslog.go
Reference baseline:
moby/moby branch master, checked on February 20, 2026.
Explanation: this is the logger implementation path used when containers emit logs to a remote syslog sink.
scrape_configs:
  - job_name: syslog
    syslog:
      listen_address: 0.0.0.0:1514
      listen_protocol: tcp
      labels:
        job: "opnsense-syslog"
    relabel_configs:
      - source_labels: ['__syslog_message_hostname']
        target_label: host
Upstream code:
loki/.../promtail/targets/syslog/syslogtarget.go
Reference baseline:
grafana/loki branch main, checked on February 20, 2026.
Explanation: Promtail maps incoming syslog metadata to labels; relabel rules define stable host naming.
scrape_configs:
  - job_name: "node"
    static_configs:
      - targets: ["node-exporter.example.com:9100"]
  - job_name: "cadvisor"
    static_configs:
      - targets: ["cadvisor.example.com:8080"]
Upstream code:
prometheus/config/config.go
Reference baseline:
prometheus/prometheus branch main, checked on February 20, 2026.
Explanation: Prometheus parses and validates this config before startup; invalid jobs fail fast.
{
  "acls": [
    {
      "action": "accept",
      "src": ["tag:ops"],
      "dst": ["tag:secure-app:443,9090,1514"]
    }
  ]
}
Source:
Tailscale ACL Syntax (official)
Upstream code:
tailscale/tailcfg/tailcfg.go
Reference baseline:
tailscale/tailscale branch main, checked on February 20, 2026.
Explanation: ACL objects are evaluated against tags/groups; DNS only resolves names and does not authorize access.
services:
  web:
    depends_on:
      db:
        condition: service_healthy
  db:
    image: postgres:18
    healthcheck:
      test: ["CMD", "pg_isready", "-U", "postgres"]
Explanation: health-gated dependencies reduce startup races and prevent temporary 502/504 during boot.
// adapted from prometheus/config package shape
cfg, err := config.LoadFile("/etc/prometheus/prometheus.yml", false, logger)
if err != nil {
  return err
}
for _, sc := range cfg.ScrapeConfigs {
  _ = sc.JobName
}
Reference:
prometheus/config/config.go
Reference baseline:
prometheus/prometheus branch main, checked on February 20, 2026.// adapted from Loki Promtail syslog target config model
type SyslogTargetConfig struct {
ListenAddress string `yaml:"listen_address"`
Labels map[string]string `yaml:"labels"`
}
// relabeling maps __syslog_message_hostname to stable host label
Reference:
loki/.../syslogtarget.go
Reference baseline:
grafana/loki branch main, checked on February 20, 2026.Ingress (VPS Traefik) Deep Dive
The public VPS is the stable entrypoint: it owns the internet-facing IP, terminates TLS for public names, and can selectively bridge traffic into private networks (only where intended).
- Responsibility: public ingress, certificate automation, optional auth/abuse controls.
- Risk posture: hardened, minimal exposed ports, strict routing rules.
- Operations: logs and access metrics provide proof of behavior.
- Internal apps are reached via tailnet DNS names and internal ingress.
- Only aggregated metrics and sanitized templates are published here.
EntryPoints, providers, ACME resolver names must match your container labels.
entryPoints:
  http:  { address: \":80\" }
  https: { address: \":443\" }

providers:
  docker:
    exposedByDefault: false

certificatesResolvers:
  cloudflare:
    acme:
      dnsChallenge:
provider: cloudflareThe exact combination that avoids the classic Traefik 404 pitfall.
traefik.enable=true
traefik.docker.network=proxy

traefik.http.routers.www.rule=Host(`www.planetonyx.net`)
traefik.http.routers.www.entrypoints=https
traefik.http.routers.www.tls.certresolver=cloudflare
Why this section is here: the most common failure mode for “it resolves but I get 404” is that a router never attaches to the real entryPoint because the label uses the wrong entryPoint/resolver/network.
Ingress Fabric (K3s + Edge Proxy)
The production path is fixed: apps are exposed through K3s Ingress and entered via the HAProxy VIP
10.10.10.6:443. This avoids node-IP drift and keeps DNS + routing stable.
- Public + private app entry stays on HAProxy VIP
10.10.10.6:443. - K3s service IPs are backend targets, not user-facing entrypoints.
- Storage traffic uses NFS exports from
kilox-stor001(ZFS-backed).
# K3s ingress objects
kubectl -n apps get ingress

# Core services
kubectl -n apps get svc

# Verify endpoint resolution
kubectl -n apps get endpoints
Primary failure mode is no longer Docker-network mismatch, but ingress/backend mismatch
(wrong service port, missing endpoints, stale DNS target).
# Ingress + backend
kubectl -n apps describe ingress <name>
kubectl -n apps get svc,pods -o wide
kubectl -n apps logs deploy/traefik --tail=200

# Edge path
curl -kI https://<app>.srv.planetonyx.net
curl -kI https://<app>.headscale.planetonyx.net- Ingress is only via routed domains; no direct node-port publishing for app UIs.
- Admin paths stay behind allowlists + SSO/2FA gates.
- Tailnet/LAN/public DNS views are intentionally separated by split-DNS policy.
Tailnet (Headscale) Deep Dive
The tailnet provides device identity and encrypted connectivity. It is not just a tunnel: it is a control plane (enrollment, ACL policy) and a transport (DERP/direct paths).
# Tailnet-only naming
*.headscale.planetonyx.net

# Client gets:
DNS server: 100.100.100.100
Search domain: headscale.planetonyx.net
Private names should not resolve publicly. This is a key containment boundary.
// HUJSON-like pattern
{ \"action\": \"accept\",
  \"src\": [\"group:admins\"],
  \"dst\": [\"tag:secure-app:*\"]
}
Use tags to express intent (e.g. “secure-app”), not physical topology.
Headscale Operations (Headplane UI)
Headplane is the operator UI for managing a Headscale environment: nodes, routes, ACL policy, and basic lifecycle tasks. It reduces the need for raw CLI work, but the security boundary still lives in tags, ACLs, and how routes and exit nodes are approved.
- Node inventory: who/what is connected, last seen, tags.
- Routes and exit nodes: approve explicitly, then monitor reachability.
- ACL policy: validate changes before applying (policy check).
If the Headscale server uses a file-based policy mode, the UI cannot write to the database. In that case you
edit the policy file and reload Headscale.
# Concept (Headscale config)
policy:
  mode: database   # UI-editable
  # mode: file     # UI read-only; edit policy.hujson on disk
Either way, policy should be backed up and reviewed like code.
- Prefer tags over IP rules (intent-based policy).
- Keep “route approval” as a deliberate action, not an automatic default.
- Regularly review “no rules matched” drops to catch missing ACLs early.
# Examples (sanitized)
headscale nodes list
headscale routes list
headscale policy check -f /etc/headscale/policy.hujson
The UI improves speed, the CLI improves determinism and is easier to reference in runbooks.
Firewalls (OPNsense HA + HAProxy)
The firewall HA pair enforces routing and policy, and it can also serve as an internal TLS termination layer. Central TLS termination reduces the number of services that must handle certificates directly.
# Frontend (TLS termination)
bind :443 ssl crt /path/to/wildcard.pem
mode tcp

# Backend (re-encrypt to internal ingress)
server nas_ingress 192.168.x.x:443 ssl verify none
TCP mode avoids subtle HTTP header/proto edge cases when the upstream already expects HTTPS.
# VIP concept
VIP: internal clients connect to one address
HA: active firewall serves; passive takes over on fail
HA turns a “single box” into a service with continuity.
Split DNS (Public vs Private)
The same base domain can have different “views” depending on where the query comes from.
Purpose: open internet resolution.
# Typical pattern
www.planetonyx.net   CNAME  vps.planetonyx.net
vps.planetonyx.net A <VPS_PUBLIC_IP>Purpose: private resolution, internal routing.
# Tailnet (MagicDNS / split DNS)
app.headscale.planetonyx.net  A  <TAILNET_INGRESS_IP>

# LAN
app.lan.planetonyx.net        A  <LAN_INGRESS_IP>
TLS & ACME (Wildcard Strategy)
Wildcard certificates require DNS-01 validation. In practice this allows a single ingress to provide valid TLS for many internal services.
*.planetonyx.net
*.lan.planetonyx.net
*.headscale.planetonyx.net
*.srv.planetonyx.netOne common definition:
Example SLO target: 99.5% over 30 days.
Math & KPI Models (Explained)
Business-like operations need definitions that survive stress. These are lightweight models to explain what we measure and why.
For a given window (e.g. 30 days):
If the SLO is 99.5%, the error budget is 0.5% of requests in that window.
Sometimes it is easier to talk in minutes:
Example: 30 days and 99.5% => ~216 minutes/month budget.
p95 means 95% of requests are faster than this threshold:
We publish p50/p95/p99 as a business-friendly “experience envelope”.
Centralization reduces the number of places that can break:
Ingress + TLS + auth in one place lowers both.
BSI Compliance Statement
For the documented platform scope, PlanetOnyx fulfills the defined BSI baseline controls and operational requirements. The implementation is mapped against BSI Standards 200-2 methodology and the current Grundschutz++ transition model.
- Identity and access controls (Authelia/2FA, role boundaries).
- Network segmentation and policy routing (tailnet + firewall zones).
- Logging, monitoring, evidence retention and incident traceability.
- Backup/recovery controls and documented change management.
- `docs/BSI-200-2-GAP-ANALYSIS.md`
- `docs/BSI-HARDENING-MAPPING.md`
- `docs/CONTROL-EVIDENCE-MATRIX.md`
- `docs/CMDB-CHANGE-MANAGEMENT-MODEL.md`
Status: Baseline controls implemented for the active production scope.
Security Layers (Auth + Abuse Protection)
The system uses layered controls. The point is not to rely on a single mechanism, but to create multiple independent gates that each reduce risk.
ForwardAuth sits in front of selected routers.
# Traefik middleware concept
middlewares:
  authelia:
    forwardauth:
      address: http://authelia:9091/api/authz/forward-auth
Result: internal dashboards and apps can require SSO, even if the upstream app has weak auth.
Detect patterns, enforce decisions via bouncer.
# ForwardAuth concept
	middlewares:
	  crowdsec-bouncer:
	    forwardauth:
	      address: http://bouncer-traefik:8080/api/v1/forwardAuth
Result: automated blocking/captcha decisions without changing every application.
A strong SSO gate changes the threat model: instead of dozens of inconsistent login surfaces, you harden one
entrypoint with MFA, lockouts, and audit logs.
- MFA enforcement for sensitive apps (TOTP or WebAuthn).
- Session security: short inactivity timeout, long-term token hygiene.
- Central incident response: one place to revoke, lock, and review.
A safe default: deny by default, then allow with
two_factor.# authelia configuration.yml (concept)
access_control:
default_policy: deny
rules:
- domain: "*.headscale.planetonyx.net"
policy: two_factor
- domain: "*.lan.planetonyx.net"
policy: two_factor
session:
expiration: 8h
inactivity: 30m
cookies:
- domain: planetonyx.net
secure: true
same_site: lax
ForwardAuth is a robust baseline. OIDC is preferred when the upstream supports it (role mapping, user
attributes, app-side sessions).
# authelia OIDC (concept)
identity_providers:
  oidc:
    clients:
      - client_id: grafana
        client_name: "Grafana"
        redirect_uris:
          - https://grafana.example.internal/login/generic_oauth
scopes: [openid, profile, email]- Prefer WebAuthn for admins (phishing-resistant).
- Enforce NTP time sync across nodes (TOTP stability).
- Never expose Authelia without strict allowlists; keep it tailnet/LAN-only.
- Rotate secrets regularly (session, JWT, storage key) and keep them out of docs.
- Credential stuffing and brute-force on exposed logins.
- Misconfigured DNS/routing exposing internal apps publicly.
- Reverse proxy bypass via direct IP/port exposure.
- Supply-chain risk via container images and dependencies.
Design goal: reduce exposed surfaces, then add strong identity and automated abuse controls.
Use TLS options and avoid legacy protocol versions.
# config.yaml (example)
tls:
  options:
    modern:
      minVersion: VersionTLS12
      sniStrict: true

# router uses:
tls:
  options: modern
certResolver: cloudflareAttach to public routers; keep it strict but not self-breaking.
# config.yaml (example)
http:
  middlewares:
    sec-headers:
      headers:
        stsSeconds: 31536000
        stsIncludeSubdomains: true
        stsPreload: true
        contentTypeNosniff: true
        browserXssFilter: true
        frameDeny: true
        referrerPolicy: no-referrer

# router:
middlewares: [sec-headers]Stops noisy clients and buys time during abuse events.
# config.yaml (example)
http:
  middlewares:
    ratelimit:
      rateLimit:
        average: 30
        burst: 60

# router:
middlewares: [ratelimit, crowdsec-bouncer]Only allow admin panels from your tailnet or a known source range.
# config.yaml (example)
http:
  middlewares:
    admin-allow:
      ipAllowList:
        sourceRange:
          - 100.64.0.0/10   # tailnet CGNAT range

# router:
middlewares: [admin-allow, authelia]Minimize privileges even for internal services.
services:
  app:
    read_only: true
    security_opt:
      - no-new-privileges:true
    cap_drop:
      - ALL
    tmpfs:
- /tmpAvoid committing secrets into compose files or docs.
# docker compose pattern
env_file: [.env]

# or (Swarm-style):
secrets:
  cf_token:
file: ./secrets/cf_token.txtLogs are part of security: capture, retain, and be able to answer questions.
# Traefik access log (json) -> rotate
/var/log/traefik/access.log

# CrowdSec decisions -> visibility
cscli decisions list -o json
Backups (Strategy)
Backups are treated as part of the platform, not an afterthought. The key principle: configs are as important as data.
- Reverse proxy + auth configuration (Traefik, Authelia), without embedding secrets in docs.
- Firewall config exports (OPNsense config.xml) and HAProxy/ACME state.
- Docker stack definitions (compose/stack files) and critical app volumes.
- Tailnet control-plane state (Headscale DB/config) and policy files.
A lightweight, frequent backup that proves the pipeline works.
# Example pattern (concept)
# - snapshot configs
# - push to backup storage
# - verify presence / retention
Keep restore steps documented and tested. A backup you never restore is not a backup.
Failure Modes (What Breaks First)
In real life the failures are rarely “the whole stack is down”. Most outages are partial, and the fastest fix comes from having a short list of likely causes with deterministic checks.
Root cause: router never attached to the active entryPoint or container is not visible.
# Is the router label correct?
docker inspect about-site-about-site-1 --format '{{json .Config.Labels}}' | jq .

# Does Traefik see the request?
docker exec traefik sh -lc 'tail -n 200 /var/log/traefik/access.log | grep -F "\"RequestHost\":\"www.planetonyx.net\""' Root cause: wrong certResolver, ACME failed, or SNI doesn't match rule.
# Quick confirm SNI path
curl -kI https://127.0.0.1/ -H 'Host: www.planetonyx.net'Root cause: policy routing, NAT, or upstream VPN gateway is broken.
# Client: route should go via tailscale0
ip route get 1.1.1.1

# Confirm DNS still works (it often does)
nslookup heise.deRoot cause: split DNS caching, different DNS view, or stale tailnet map.
tailscale status
resolvectl status
resolvectl query <host>
Routing & Policy
Routing is treated as a first-class control surface: separate ingress interfaces (LAN vs tailnet), explicit allow rules, and policy routing only where intended.
When a client enables an exit node, its default route becomes the tailnet tunnel.
# Client view (conceptual)
ip route get 1.1.1.1
=> dev tailscale0Example: route tailnet traffic to a VPN gateway, but keep LAN local.
# Pseudocode
if ingress == tailscale0:
  route-to VPN_GW
else:
  normal routing
Outbound NAT (The Hard Part)
Outbound NAT becomes non-trivial as soon as you combine multiple ingress interfaces (LAN + tailnet), policy
routing (e.g. wg1 to a VPN provider), and split DNS. The failure modes are subtle: DNS still works,
but traffic times out because NAT or asymmetric routing is wrong.
- Asymmetric routing: packets leave via VPN, replies return via WAN (state breaks).
- NAT applied on the wrong interface (or missing on the VPN uplink).
- Over-broad rules: tailnet traffic accidentally NATs into LAN or bypasses security gates.
- Exceptions list: some destinations must never go to VPN (RFC1918, management networks, backups).
Goal: traffic entering via
tailscale0 goes to VPN (wg1), except internal ranges.
# OPNsense/pf concept (pseudocode)
# 1) Block tailnet -> RFC1918 by default (unless explicitly allowed)
block in quick on tailscale0 from 100.64.0.0/10 to <RFC1918>

# 2) Route tailnet traffic to VPN for non-internal destinations
pass in quick on tailscale0 route-to (wg1 <VPN_GW>)
  from 100.64.0.0/10 to ! <NO_WG_POLICY> keep state

# 3) NAT on VPN uplink
nat on wg1 from 100.64.0.0/10 to any -> (wg1)
The alias
NO_WG_POLICY is where you put internal prefixes and "must stay local" destinations.
# Client side
ip route get 1.1.1.1
curl -4sv --connect-timeout 5 https://ifconfig.me/ -o /dev/null

# Firewall side (concept)
- check states (are they created on tailscale0?)
- packet capture on tailscale0 and wg1
- verify NAT rules on the actual egress interface- Keep a strict "tailnet ingress policy": allow by intent, not by convenience.
- Keep exception lists small and reviewed (aliases are your friend).
- Document the "must never go to VPN" destinations (backups, management, internal DNS).
- Wildcards require DNS-01; HTTP-01 can't issue
*.example.com. - DNS propagation and API permissions are the common failure points.
- Provider rate limits apply: use staging for tests, production only when stable.
Practical outcome: you automate it once, then you stop thinking about cert renewals.
# traefik.yaml (concept)
certificatesResolvers:
  cloudflare:
    acme:
      email: you@example.com
      storage: acme.json
      dnsChallenge:
        provider: cloudflare
        resolvers:
          - 1.1.1.1:53
          - 1.0.0.1:53

# secret handling (concept)
env_file: [.env]  # contains CF_DNS_API_TOKEN
Keep tokens out of compose and out of docs. Use
env_file or Docker secrets.
- Public: VPS Traefik terminates TLS for public names.
- Private: HAProxy can terminate wildcard TLS for internal admin UIs.
- Apps: run without cert automation complexity; they sit behind a trusted ingress.
# Confirm correct SNI path (concept)
curl -vkI https://www.planetonyx.net/

# If wrong cert:
# - router rule mismatch
# - resolver name mismatch
# - ACME failed (check logs and storage)
Traffic Shaping (QoS + Bufferbloat Control)
The intent is not to maximize raw throughput. It is to keep latency stable under load. Shaping slightly below the real link rate prevents bufferbloat, makes VPN routing usable, and keeps interactive traffic responsive.
Set limiter rates a bit below the provider line rate:
In practice: tune to the measured stable throughput, not the marketing number.
# Limiters (example values)
WAN_DOWN: 475 Mbit/s  (fq_codel)
WAN_UP:    95 Mbit/s  (fq_codel)

# Apply on egress for WAN and on egress for VPN uplink (wg1),
# depending on which path your traffic takes.
fq_codel (or CAKE, where available) is chosen because it is robust for mixed flows.
- Shaping only on download but not upload (upload is where latency often dies).
- Setting shaper above real throughput (no effect, buffers still fill).
- Applying limiters on the wrong interface (VPN vs WAN).
# Quick check idea
- run a sustained upload/download
- ping a stable host in parallel
- latency should remain bounded instead of climbing into seconds
Monitoring (Prometheus, Grafana, Alerts)
Monitoring is not “pretty graphs”. The goal is operational truth: detect failures early, correlate symptoms to causes, and create a feedback loop for capacity and security decisions.
- System health: CPU, memory, disk usage, IO latency (node exporter).
- Container health: restarts, memory pressure, throttling (cAdvisor).
- Edge health: status buckets, p95 latency, request rate (Traefik logs/metrics).
- Network health: DNS, ICMP loss/latency, route reachability (blackbox checks).
- Security signals: auth failures and bouncer decisions (Authelia/CrowdSec).
- Page only on user-impacting conditions (ingress down, auth outage, route broken).
- Ticket on capacity trends (disk growth, sustained error budget burn).
- Keep alerts few, specific, and actionable.
# Example: error budget burn (concept)
burn = rate(http_requests_total{code=~"5.."}[5m]) /
       rate(http_requests_total[5m])

alert if burn > 0.01 for 10m# Examples (conceptual)
- Ingress down (no 2xx/3xx for 5m)
- DNS failure for internal domains
- Route advertised but target unreachable
- Disk > 85% for 30m
- Container crashloop (restarts > N in 10m)
A small, trusted alert set beats a large, noisy one.
# Examples (concept)
authelia_login_failures_total      # brute force / mistyped creds detection
crowdsec_decisions_active          # active blocks / pressure indicator
traefik_router_requests_total      # traffic and status buckets
Even when you never publish the raw numbers, this is what makes the platform debuggable.
Observability (Metrics, SLOs, Health)
Public site version: aggregated metrics derived from the edge proxy logs. This is useful to validate that the public endpoint is alive, responds quickly, and stays within expected error budgets.
Request rate (last 60 minutes)
Bars represent requests per 5 minutes for
www.planetonyx.net.Traffic mix
Public vs tailnet vs other (counts only).
Status buckets
2xx/3xx/4xx/5xx, aggregated.
Methods
HTTP methods, aggregated.
Edge components
Running/healthy/stopped, aggregated.
Headscale presence
Online vs offline nodes (counts only).
If you want exact values in addition to pies.
| Bucket | Count |
|---|
| Method | Count |
|---|
Most requested paths (public host only).
| Path | Count |
|---|
# Uptime (probe_success)
avg_over_time(probe_success[24h])

# HTTP availability (%)
100 * (1 - (sum(rate(http_requests_total{code=~\"5..\"}[5m])) /
           sum(rate(http_requests_total[5m]))))

# Latency p95
histogram_quantile(0.95, sum(rate(http_request_duration_seconds_bucket[5m])) by (le))# ICMP packet loss p95 (concept)
histogram_quantile(0.95, rate(ping_loss_bucket[24h]))
In production, keep internal targets private; publish only aggregates if needed.
Logs (Sanitized Examples + Filter)
Example lines in the style of Traefik access logs (JSON). Filter by host, status code, router, or path.
filter
{"ClientHost":"203.0.113.18","RequestHost":"www.planetonyx.net","RequestMethod":"GET","RequestPath":"/","DownstreamStatus":200,"entryPointName":"https","RouterName":"www-planetonyx-net@docker","Duration":8123456}{"ClientHost":"203.0.113.18","RequestHost":"dockhand.planetonyx.net","RequestMethod":"GET","RequestPath":"/api/events","DownstreamStatus":401,"RouterName":"dockhand@docker","middlewares":["authelia@file","crowdsec-bouncer@file"]}{"ClientHost":"198.51.100.7","RequestHost":"prowlarr.headscale.planetonyx.net","RequestMethod":"GET","RequestPath":"/","DownstreamStatus":302,"RouterName":"headscale-edge@file","Duration":2401123}Runbooks (Curated Commands)
These are safe templates. Replace placeholders with your actual values.
# 1) Verify Traefik sees a router
docker inspect <container> --format '{{json .Config.Labels}}' | jq -r 'keys[]' | sort

# 2) Trace why you get 404
curl -k https://127.0.0.1/ -H 'Host: www.planetonyx.net' -o /dev/null -w 'code=%{http_code}\n'
docker exec traefik sh -lc 'tail -n 200 /var/log/traefik/access.log | grep -F \"\\\"RequestHost\\\":\\\"www.planetonyx.net\\\"\" | tail -n 20'

# 3) DNS validation from a public resolver
dig +short CNAME www.planetonyx.net @1.1.1.1
dig +short A www.planetonyx.net @1.1.1.1

# 4) Refresh public-safe atlas data (host cron/systemd timer recommended)
/root/about-site/tools/generate_public_atlas_data.sh
Reporting Summary (Visual)
Consolidated status from current operations work. This section is rendered on-page only and does not expose raw markdown report files.
Security
Hardened
Syslog bind restricted to tailnet, SSH tightened, unneeded NFS server ports closed.
Recovery
Automated
Smart reboot restore + guardrails timer + alert self-test are active.
Rotation
In Progress
Headscale API key rotated; external provider token rotation deferred by owner.
Docs
Centralized
Canonical NFS docs share established and synced to local mirror.
Implementation Progress
Relative progress by workstream (operational estimate).
Status Distribution
Current report inventory state
Completed: 64%
Deferred: 22%
Open: 14%
- Security hardening baseline with verified controls.
- Hostname classification and ingress termination map.
- Monthly restore drill process and evidence template.
- Release status updated with implemented priorities.
- Telegram bot token rotation (deferred by owner).
- Cloudflare DNS API token rotation for Traefik ACME.
- Optional staged Influx token rotation in maintenance window.
About
I'm Marcus G. Steck. I build pragmatic infrastructure that makes home and edge systems behave like a small production platform: predictable ingress, strong identity and access control, good observability, and automation that reduces operational risk.
I like systems that are explainable. If a service is “up”, I want to know why. If it is “down”, I want the shortest path from symptom to root cause, with logs and metrics that actually answer questions.
- Reverse proxies and TLS automation (Traefik, HAProxy, DNS-01 wildcards).
- Network overlays, routing, and access control (Headscale/Tailscale, ACLs, split DNS).
- Operational tooling (monitoring, runbooks, reproducible Docker deployments).
- Security guardrails (CrowdSec, auth gateways, least privilege).
A VPS-first ingress with private tailnet services and an HA firewall layer that centralizes TLS and policy.
public:  DNS -> VPS Traefik -> container routing
private: tailnet + split DNS -> HAProxy VIP -> NAS ingress